এখন থেকে আমরা Elev8
আমরা শুধুমাত্র একটি ব্রোকার নই। আমরা একটি সর্বাত্মক ট্রেডিং ইকোসিস্টেম—বিশ্লেষণ, ট্রেড, এবং প্রবৃদ্ধির জন্য আপনার যা কিছু প্রয়োজন তা এক জায়গায়। আপনার ট্রেডিং উন্নত করতে প্রস্তুত?
আমরা শুধুমাত্র একটি ব্রোকার নই। আমরা একটি সর্বাত্মক ট্রেডিং ইকোসিস্টেম—বিশ্লেষণ, ট্রেড, এবং প্রবৃদ্ধির জন্য আপনার যা কিছু প্রয়োজন তা এক জায়গায়। আপনার ট্রেডিং উন্নত করতে প্রস্তুত?
USD/ZAR drop to 17.30, down 0.30% on a day during Tuesday’s Asian session. The pair recently confirmed a rising wedge bearish formation. However, the sellers seem to catch a breather around three-day low off-late.
The pair’s trading below 200-bar SMA offers extra strength to the sellers’ fraternity, in addition to the downbeat chart pattern.
As a result, June 04 high around 17.08 can act as immediate support for the pair ahead of the 17.00 round-figure. Though, the pair’s further weakness may dwindle around 16.75/70, if not then the odds of refreshing the monthly low near 16.30 can’t be ruled out.
Meanwhile, the support-turned-resistance and 200-bar SMA together offers a near-term important upside barrier around 17.55. Also restricting the quote’s immediate rise will be 50% Fibonacci retracement level of the pair’s fall from May 04 to June 10, at 17.65.
Should there be a clear rise past-17.65, the buyers might not hesitate to aim for the 18.00 threshold.
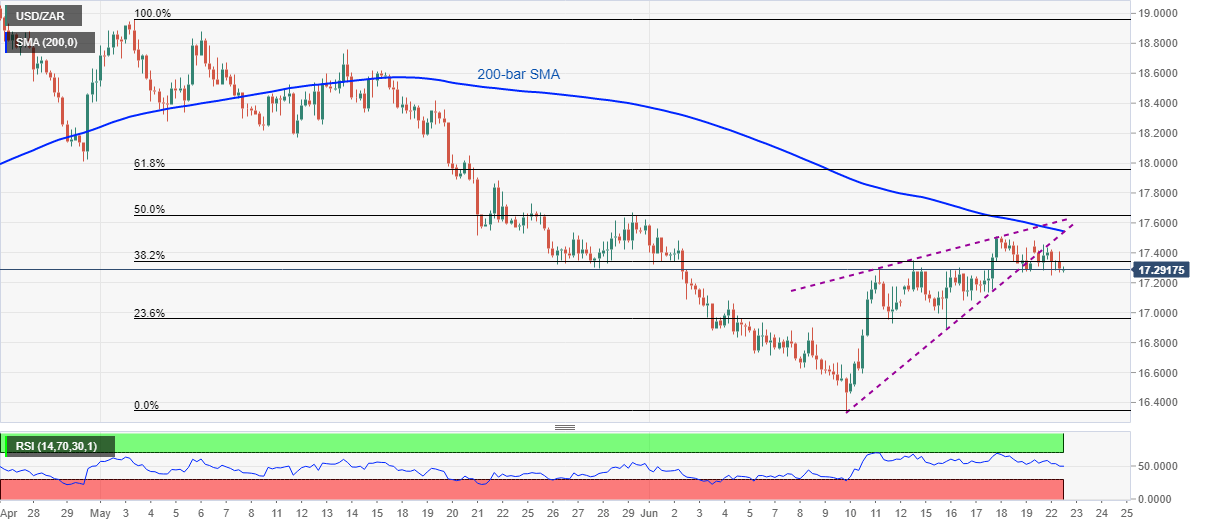
Trend: Bearish