এখন থেকে আমরা Elev8
আমরা শুধুমাত্র একটি ব্রোকার নই। আমরা একটি সর্বাত্মক ট্রেডিং ইকোসিস্টেম—বিশ্লেষণ, ট্রেড, এবং প্রবৃদ্ধির জন্য আপনার যা কিছু প্রয়োজন তা এক জায়গায়। আপনার ট্রেডিং উন্নত করতে প্রস্তুত?
আমরা শুধুমাত্র একটি ব্রোকার নই। আমরা একটি সর্বাত্মক ট্রেডিং ইকোসিস্টেম—বিশ্লেষণ, ট্রেড, এবং প্রবৃদ্ধির জন্য আপনার যা কিছু প্রয়োজন তা এক জায়গায়। আপনার ট্রেডিং উন্নত করতে প্রস্তুত?
Following its drop to the lowest in more than a week, not to forget downside break of 10-day SMA, AUD/JPY retraces losses to 0.6515 amid the Asian session on Thursday.
Even so, the pair remains below 38.2% Fibonacci retracement level of February-March declines, at 65.45, a break of which could push it to probe 10-day SMA level of 65.80.
If at all the buyers, based on the bullish MACD, manage to break 10-day SMA on a daily closing basis, 21-day SMA, currently at 66.20, could question further upside of the pair, if not then a horizontal line from March 12, near 67.70, will be the key to watch.
On the downside, 64.00 could please bears below the quote’s declines under the latest low near 64.90/85.
Additionally, 23.6% Fibonacci retracement level near 63.30 and March 18 low near 61.70 can please return to the chart given the sellers’ dominance past-64.85.
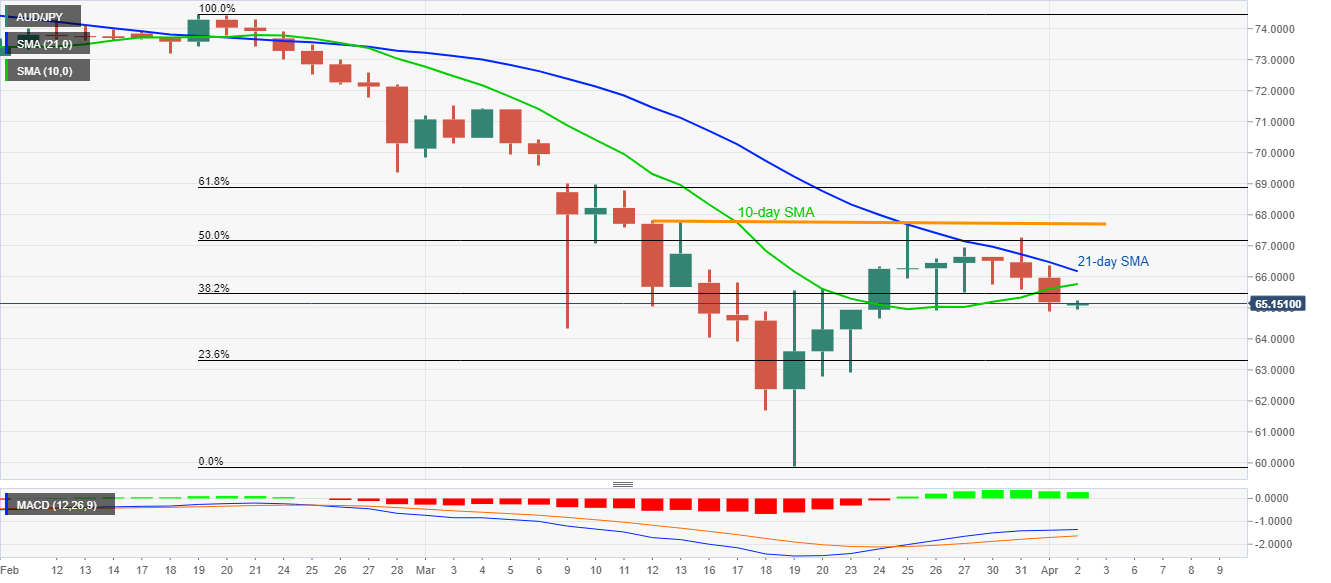
Trend: Bearish