Mulai sekarang kamiialah Elev8
Kami lebih daripada sekadar broker. Kami adalah ekosistem dagangan serba ada—semua yang anda perlukan untuk menganalisis, berdagang, dan berkembang ada di satu tempat. Sedia untuk tingkatkan dagangan anda?
Kami lebih daripada sekadar broker. Kami adalah ekosistem dagangan serba ada—semua yang anda perlukan untuk menganalisis, berdagang, dan berkembang ada di satu tempat. Sedia untuk tingkatkan dagangan anda?
EUR/GBP declines 0.05% to 0.8615 during the pre-Europe session on Monday. In doing so, the pair takes a U-turn from a confluence of 200-day EMA and 50% Fibonacci retracement level of its October-December fall.
That said, December 2019 top surrounding 0.8600 and 38.2% Fibonacci retracement near 0.8560 acts as the immediate supports to watch.
However, buyers should not lose their hopes unless EUR/GBP prices slip below the 100-day EMA level of 0.8540 on a daily closing basis.
Meanwhile, bullish MACD favors the odds of the pair’s further upside towards 61.8% Fibonacci retracement level of 0.8735.
In a case where the quote remains positive past-0.8735, September 2019 low close to 0.8785 will be the key to watch.
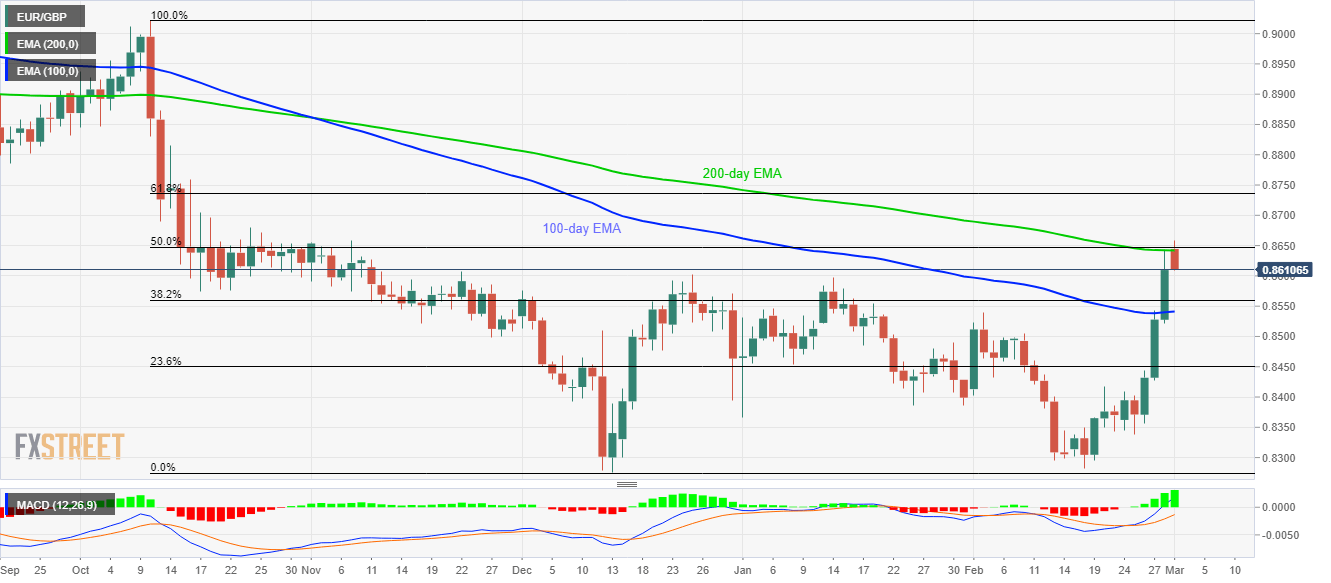
Trend: Bullish