Kể từ bây giờ chúng tôi là Elev8
Chúng tôi không chỉ là một nhà môi giới. Chúng tôi là một hệ sinh thái giao dịch tất cả trong một—mọi thứ bạn cần để phân tích, giao dịch và phát triển đều có ở một nơi. Sẵn sàng nâng tầm giao dịch của bạn?
Chúng tôi không chỉ là một nhà môi giới. Chúng tôi là một hệ sinh thái giao dịch tất cả trong một—mọi thứ bạn cần để phân tích, giao dịch và phát triển đều có ở một nơi. Sẵn sàng nâng tầm giao dịch của bạn?
USD/JPY steps back to 112.00, down 0.07%, during the pre-European session on Friday. Even so, the pair stays above the multi-month-old falling trend line on a weekly basis.
Should the pair closes the week beyond 111.40 resistance-turned-support, its run-up to 112.40 and November 2018 high near 114.20 can be expected.
During the pair’s extended rise past-114.20, October 2018 top surrounding 114.55 will be on the bulls’ radar.
Meanwhile, a downside break of 111.40 on the weekly closing basis can recall a 200-week SMA level of 109.70.
However, 111.00 and January 2020 peak close to 110.30 may offer intermediate halts to the declines.
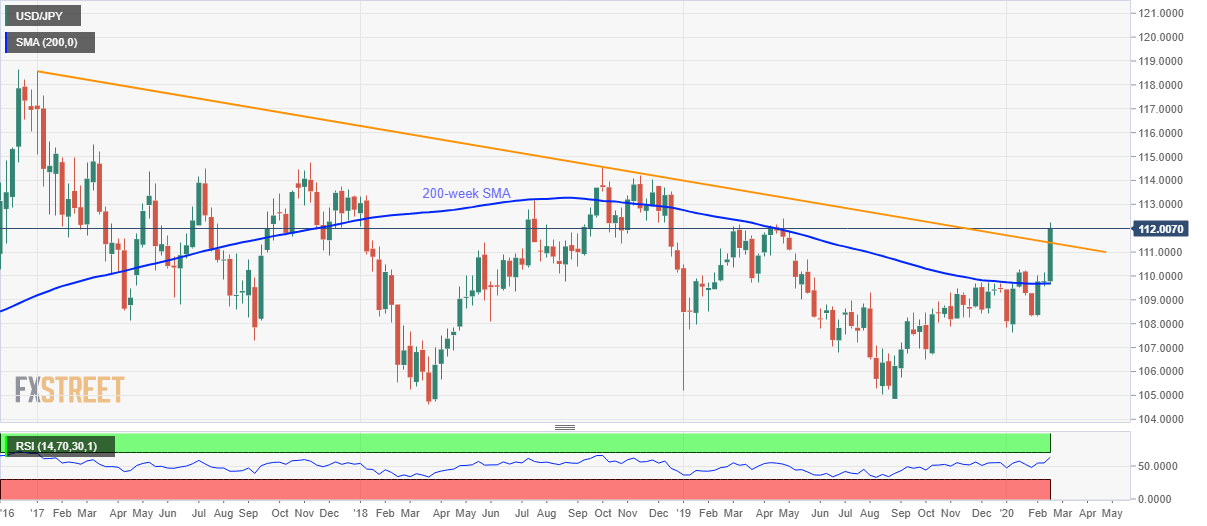
Trend: Bullish