Kể từ bây giờ chúng tôi là Elev8
Chúng tôi không chỉ là một nhà môi giới. Chúng tôi là một hệ sinh thái giao dịch tất cả trong một—mọi thứ bạn cần để phân tích, giao dịch và phát triển đều có ở một nơi. Sẵn sàng nâng tầm giao dịch của bạn?
Chúng tôi không chỉ là một nhà môi giới. Chúng tôi là một hệ sinh thái giao dịch tất cả trong một—mọi thứ bạn cần để phân tích, giao dịch và phát triển đều có ở một nơi. Sẵn sàng nâng tầm giao dịch của bạn?
NZD/USD declines to the fresh eight-week low of 0.6479, -0.20%, by the press time of early Friday. The pair dropped below 200-day SMA the previous day but is yet to provide a daily closing below 50% Fibonacci retracement level of October-December 2019 upside.
Following the 0.6480 support, sellers will look for a clear break below 100-day SMA and November high, at 0.6467 now, to aim for November 20 high near 0.6440.
In a case where prices keep being weak past-0.6440, 61.8% Fibonacci retracement near 0.6415 and November 08 low around 0.6315 will gain market attention.
Meanwhile, an upside daily close beyond a 200-day SMA level of 0.6510 can push the pair to 38.2% Fibonacci retracement level of 0.6545 and then to January 22 low near 0.6580.
However, a downward sloping trend line from December 31, 2019, at 0.6595, could challenge the pair’s recovery moves beyond 0.6580.
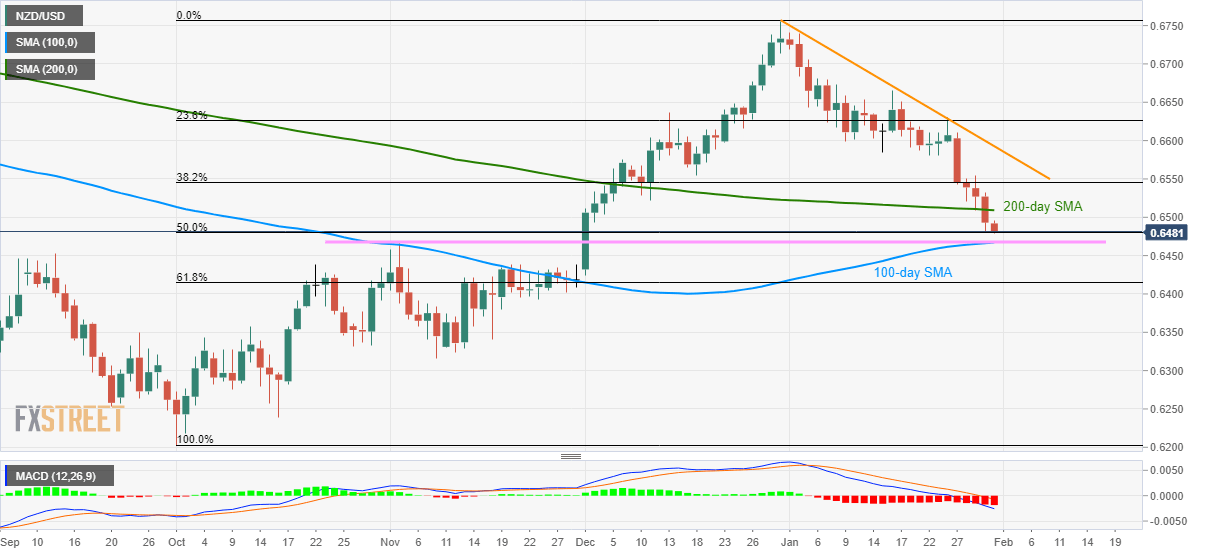
Trend: Bearish