अब से हम Elev8 हैं
हम केवल एक ब्रोकर नहीं हैं। हम एक ऑल-इन-वन ट्रेडिंग इकोसिस्टम हैं—आपको विश्लेषण करने, ट्रेड करने और बढ़ने के लिए जो कुछ भी चाहिए, वह एक ही स्थान पर है। क्या आप अपने ट्रेडिंग को ऊँचा उठाने के लिए तैयार हैं?
हम केवल एक ब्रोकर नहीं हैं। हम एक ऑल-इन-वन ट्रेडिंग इकोसिस्टम हैं—आपको विश्लेषण करने, ट्रेड करने और बढ़ने के लिए जो कुछ भी चाहिए, वह एक ही स्थान पर है। क्या आप अपने ट्रेडिंग को ऊँचा उठाने के लिए तैयार हैं?
USD/CHF takes the bids to 0.9740, following an intra-day high of 0.9744, amid the initial trading session on Wednesday. The pair recently crossed 21-day SMA and 23.6% Fibonacci retracement of its October 2019 to January 16, 2020 low. If the same is looked in conjunction with the price-positive oscillators like MACD and RSI, the current recovery is likely to extend.
In doing so, January 10 top of 0.9763 and 38.2% Fibonacci retracement near 0.9771 can offer immediate resistance ahead of highlighting a 50-day SMA level of 0.9791.
If at all bulls remain interested beyond 0.9791, an area comprising October 2019 low and multiple tops marked during late-December 2019, around 0.9832/37 could return to the charts.
Alternatively, pair’s declines below 23.6% Fibonacci retracement and 21-day SMA, respectively near 0.9710 and 0.9698, can push the bears towards 0.9660 and the monthly low of 0.9613.
During the quote’s extended south-run past-0.9613, 0.9600 will be in focus.
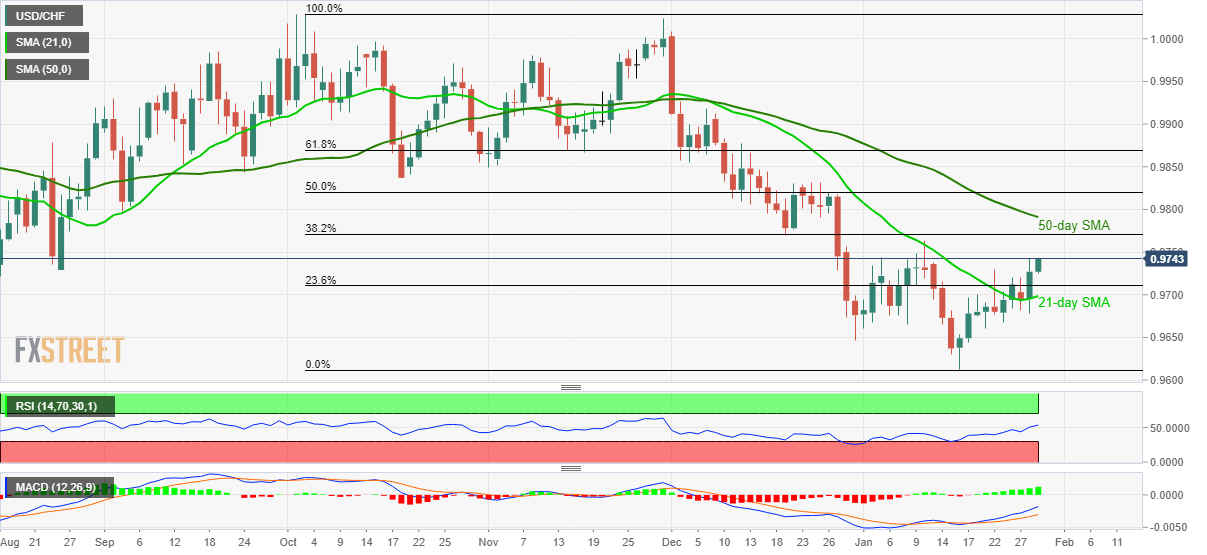
Trend: Recovery expected