นับต่อจากนี้ เราคือ Elev8
เราไม่ได้เป็นแค่โบรกเกอร์ แต่เป็นระบบนิเวศการเทรดครบวงจร ทุกสิ่งที่คุณต้องการในการวิเคราะห์ เทรด และเติบโตอยู่ในที่เดียว พร้อมยกระดับการเทรดของคุณหรือยัง?
เราไม่ได้เป็นแค่โบรกเกอร์ แต่เป็นระบบนิเวศการเทรดครบวงจร ทุกสิ่งที่คุณต้องการในการวิเคราะห์ เทรด และเติบโตอยู่ในที่เดียว พร้อมยกระดับการเทรดของคุณหรือยัง?
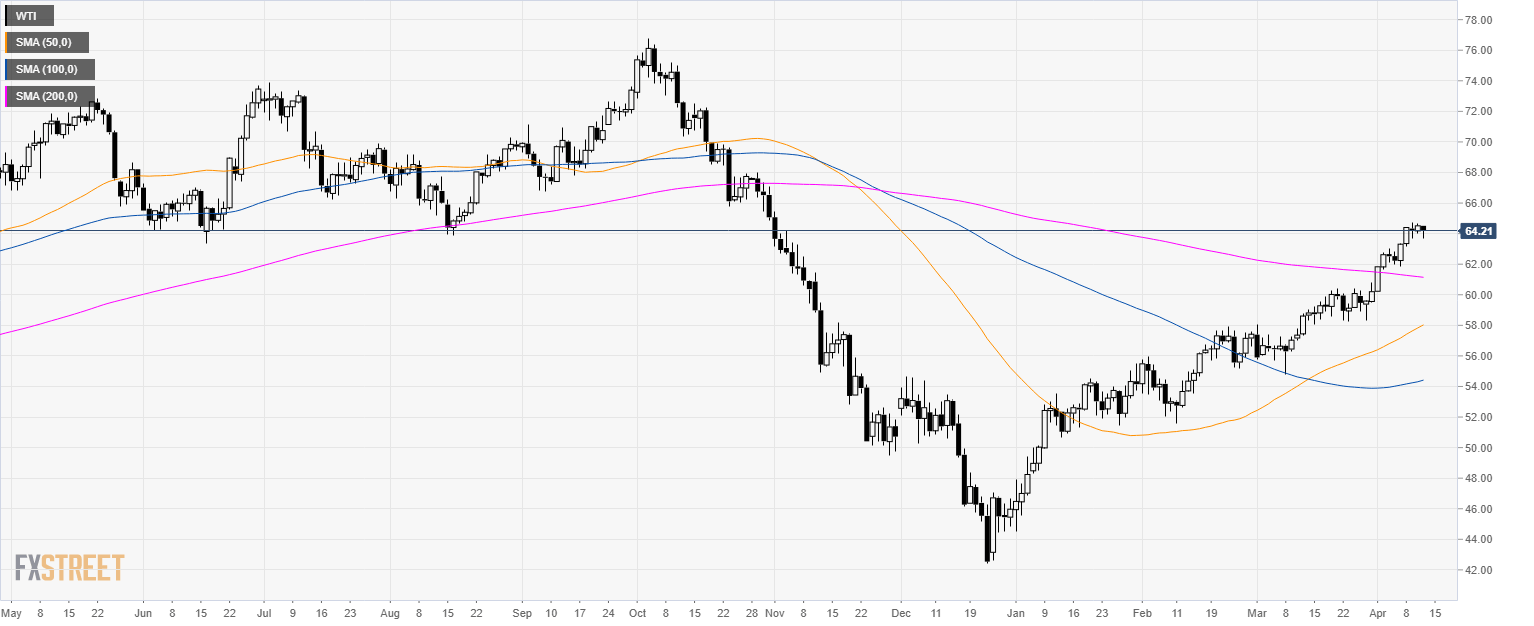
Oil daily chart
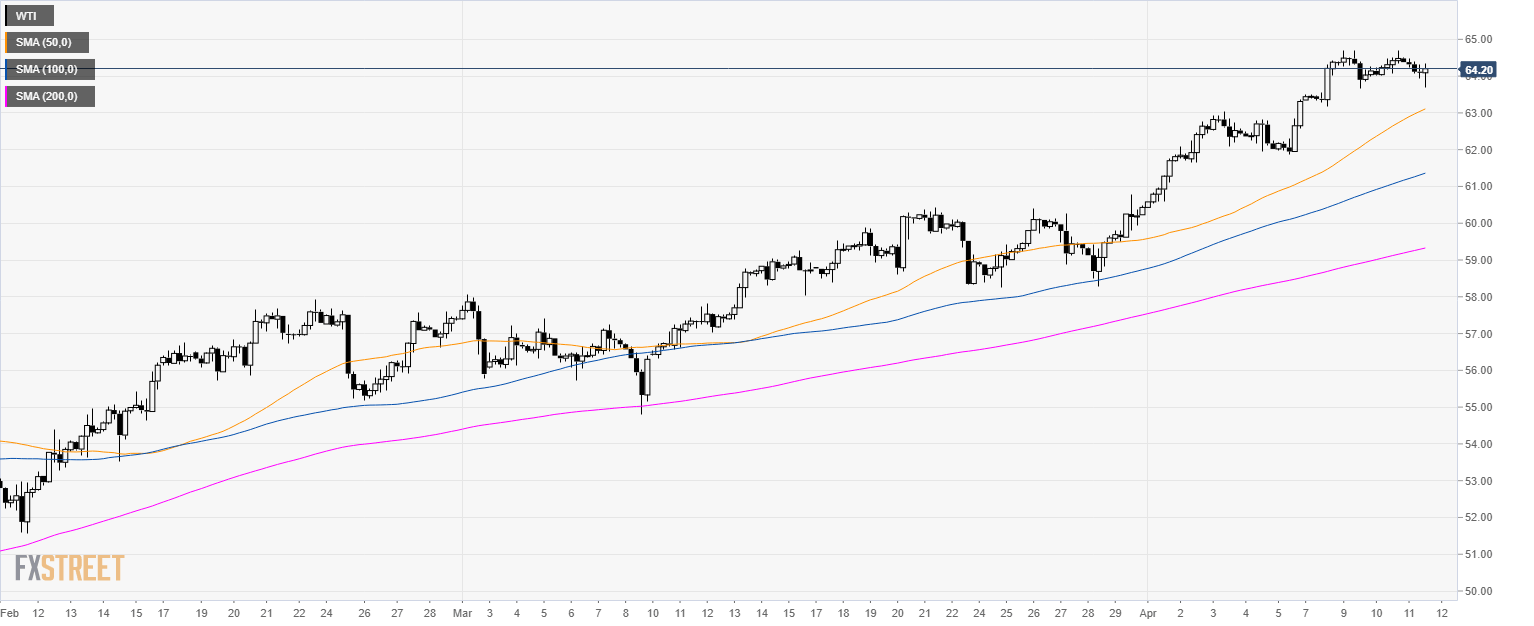
Oil 4-hour chart
Oil 30-minute chart
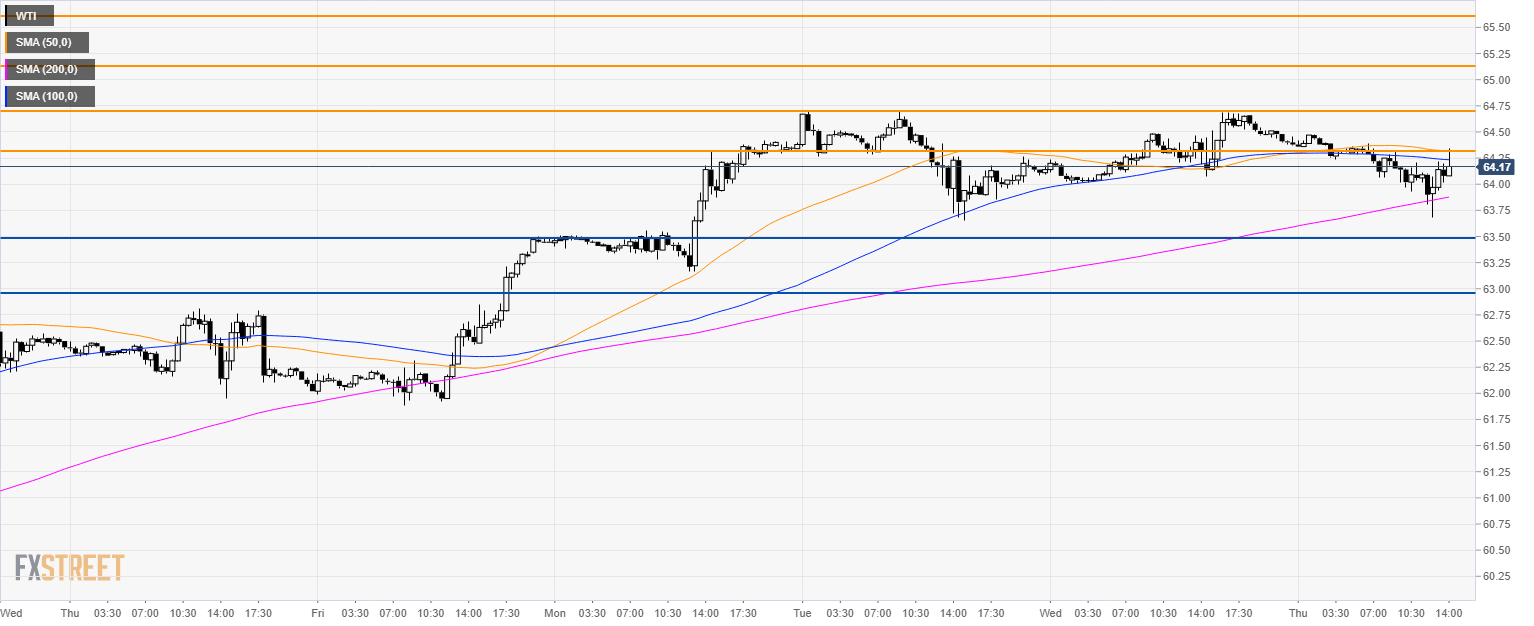
Additional key levels