এখন থেকে আমরা Elev8
আমরা শুধুমাত্র একটি ব্রোকার নই। আমরা একটি সর্বাত্মক ট্রেডিং ইকোসিস্টেম—বিশ্লেষণ, ট্রেড, এবং প্রবৃদ্ধির জন্য আপনার যা কিছু প্রয়োজন তা এক জায়গায়। আপনার ট্রেডিং উন্নত করতে প্রস্তুত?
আমরা শুধুমাত্র একটি ব্রোকার নই। আমরা একটি সর্বাত্মক ট্রেডিং ইকোসিস্টেম—বিশ্লেষণ, ট্রেড, এবং প্রবৃদ্ধির জন্য আপনার যা কিছু প্রয়োজন তা এক জায়গায়। আপনার ট্রেডিং উন্নত করতে প্রস্তুত?
AUD/JPY trades near 79.60 during the early Asian session on Thursday. The pair revisited the multiple-tops marked since April 05 after China’s inflation data flashed mixed results.
If at all present optimism surrounding Australian Dollar (AUD) manage to clear 79.65 upside barrier, 61.8% Fibonacci expansion (FE) of its March 29 April 08 moves, at 79.75, followed by 80.00 could offer intermediate halts during the pair’s theoretical rise towards 80.30. The 200-day simple moving average (SMA) level on the daily chart also validates the importance of 80.30 figure as a strong upside resistance past-79.65.
Given the pair’s sustained increase above 80.30, 80.65/70 area comprising December 2018 lows and 81.00 round-figure might flash on the Bulls’ radar.
Alternatively, nearly ascending trend-line at 79.35, followed by a week-long upward sloping support-line at 79.10, could restrict the pair’s short-term declines.
If prices slide beneath 79.10, ascending triangle break can be confirmed which in turn signal the quote’s further south-run to 78.70 and 78.50 supports.
AUD/JPY hourly chart
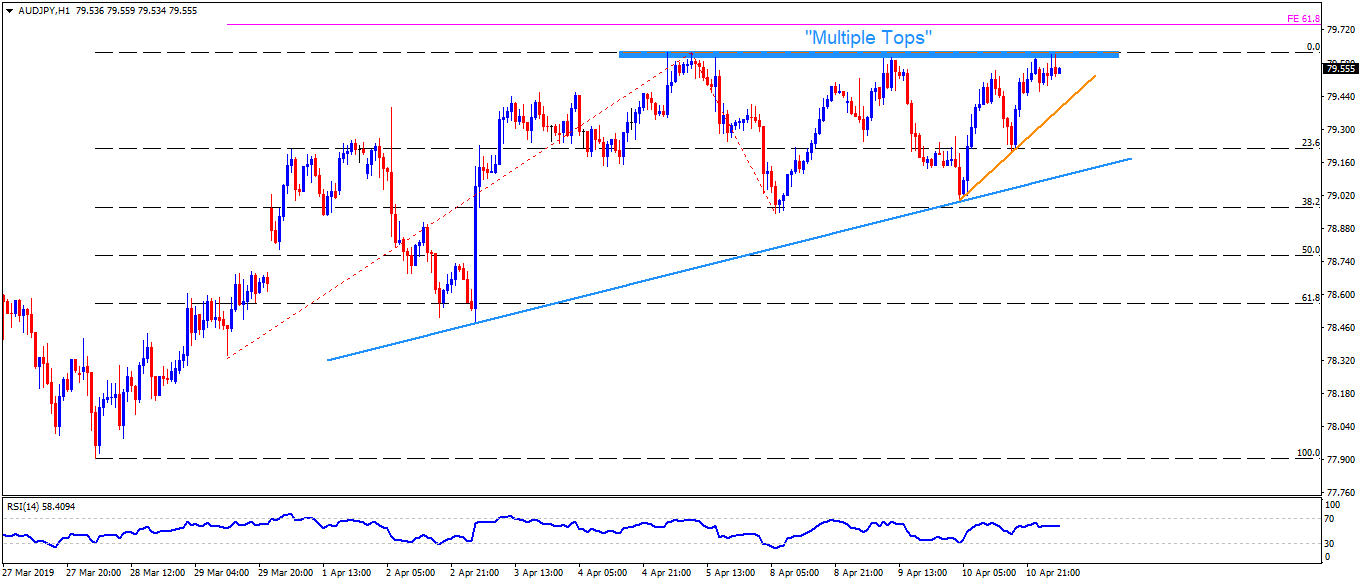
Trend: Bullish